5 Steps To Design Pert Chart Analysis Templates
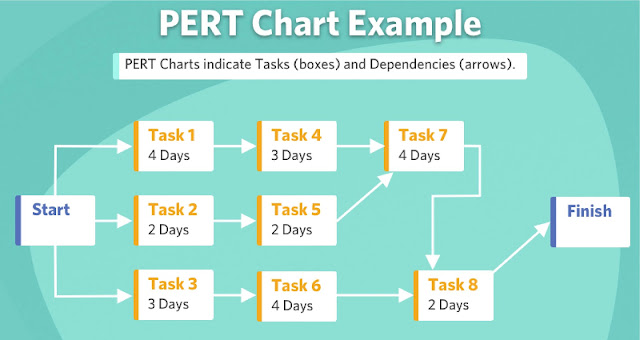
Creating effective PERT Chart Analysis Templates requires careful planning and structured steps to ensure clarity and efficiency in project management. A PERT chart, which stands for Program Evaluation and Review Technique, is a visual representation of project tasks and their dependencies, essential for tracking progress and managing timelines effectively.
Here’s a comprehensive guide on how to design PERT chart analysis templates to optimize project workflows and achieve project goals seamlessly.
Define Project Scope and Objectives: Begin by clearly defining the scope of your project and identifying its objectives. This foundational step sets the direction for the entire PERT chart analysis. List all tasks and activities that need to be accomplished to achieve the project's goals. Break down complex tasks into smaller, manageable sub-tasks to ensure comprehensive coverage of project requirements.
Identify Task Dependencies: Analyze the relationships and dependencies between tasks. Tasks in a project often rely on the completion of preceding activities or are parallel to others. Identify these dependencies to accurately represent them in the PERT chart. Understanding task dependencies is crucial for scheduling and resource allocation, ensuring that activities are sequenced logically and efficiently.
Estimate Task Durations: Estimate the time required to complete each task in the project. Use historical data, expert judgment, and consultations with team members to make realistic estimates. Avoid overestimating or underestimating durations to maintain accuracy in your PERT chart analysis. Clearly indicate task durations to visualize the critical path—the sequence of tasks that determines the minimum project duration.
Create the PERT Chart Template: Construct the PERT chart using a suitable software tool or drawing application. Start with a node for each task and use arrows to indicate dependencies between tasks. Include task names, estimated durations, and milestones on the chart. Use different colors or shapes to differentiate between types of tasks or milestones, enhancing clarity and readability.
Review and Refine: Review the initial draft of your template with project stakeholders and team members. Gather feedback on the accuracy of task dependencies, durations, and overall flow of the chart. Refine the template based on feedback to ensure it accurately reflects the project's scope and timeline. Regularly update the PERT chart throughout the project lifecycle to track progress and adjust timelines as needed.
Implementing these steps ensures that your PERT chart analysis template is a valuable tool for project management. By providing a visual roadmap of tasks, dependencies, and timelines, the PERT chart facilitates effective decision-making, resource allocation, and risk management. It enables project managers and teams to identify critical tasks, allocate resources efficiently, and maintain project schedules, ultimately leading to successful project outcomes.
Defining the Pros and Cons:
Pros and cons of PERT chart analysis templates provide insights into their utility and limitations in project management:
Pros:
Visual Clarity: PERT charts offer clear visual representation of tasks and timelines, aiding communication and understanding among team members.
Critical Path Identification: They highlight the critical path, helping prioritize tasks crucial for project completion and timeline adherence.
Structured Planning: PERT charts break down complex projects into manageable tasks, facilitating systematic planning and resource allocation.
Risk Management: By visualizing dependencies, PERT charts enable proactive identification and mitigation of potential risks.
Enhanced Coordination: They promote coordinated efforts by outlining task dependencies and sequencing, ensuring tasks are completed in logical order.
Cons:
Complexity: PERT charts can become unwieldy in large projects, requiring meticulous management and updates.
Estimation Reliability: They heavily rely on estimated task durations, which may differ from actual execution, impacting timeline accuracy.
Limited Flexibility: Changes in project scope or unexpected events may necessitate significant adjustments to the PERT chart, affecting its reliability.
Resource Management: PERT charts primarily focus on task sequencing and timelines, often overlooking resource constraints and allocation.
Skill Requirement: Effective utilization of PERT charts demands expertise in project management and critical path methodology, posing a learning curve for inexperienced users.
Read More: Program evaluation and review technique - Wikipedia
Conclusion:
In short, designing this effective template involves systematic planning and attention to detail. By defining project scope, identifying task dependencies, estimating durations, creating the chart, and reviewing it regularly, you establish a robust framework for managing projects effectively. The PERT chart serves as a dynamic tool that evolves with the project, guiding teams towards achieving milestones and delivering results within specified timelines. Incorporate these steps into your project management process to harness the power of PERT charts and enhance project success.
By following these steps, you can create PERT Chart Analysis Templates that serve as invaluable assets in project management. They provide clarity, structure, and insight into project workflows, enabling teams to streamline processes, mitigate risks, and achieve project goals efficiently. Incorporate PERT charts into your project management toolkit to enhance organizational efficiency and deliver projects successfully.
#PERT #Excel Templates #Strategic Templates #Powerful Excel #Program Evaluation #Dynamic Dashboard #Excel #PERT Analysis #PMO #Evaluation #Effective Analysis


.jpg)

Comments
Post a Comment